The Time Segmented Volume (TSV) is a technical indicator that measures the volume of a financial instrument within specific time segments. It helps traders identify buying and selling pressure based on volume analysis. The TSV indicator can be used as part of a trading strategy to generate trade signals and confirm market trends. Let’s explore how to use the TSV indicator as a trading strategy.
To begin, add the TSV indicator to your trading platform. The TSV is typically represented as a line or histogram chart overlaying the price chart. The indicator calculates volume accumulation and distribution based on price movement within a specified time segment, such as daily, weekly, or monthly.
Here’s how to use the TSV indicator as a trading strategy:
-
Identify divergences: Look for divergences between the TSV and the price chart. Divergences occur when the TSV and the price move in opposite directions. For example, if the price is making higher highs while the TSV is making lower highs, it could indicate a potential reversal or change in trend.
-
Confirm trend strength: Analyze the TSV to confirm the strength of the prevailing trend. If the TSV is rising along with the price, it suggests strong buying pressure and validates the upward trend. Conversely, if the TSV is declining while the price is rising, it could indicate weakening buying interest and a potential trend reversal.
-
Watch for breakouts: Monitor the TSV for breakouts or significant changes in its direction. A breakout in the TSV could signal a shift in market sentiment and the potential start of a new trend. For example, if the TSV breaks above a significant resistance level, it suggests increasing buying pressure and the potential for further price appreciation.
-
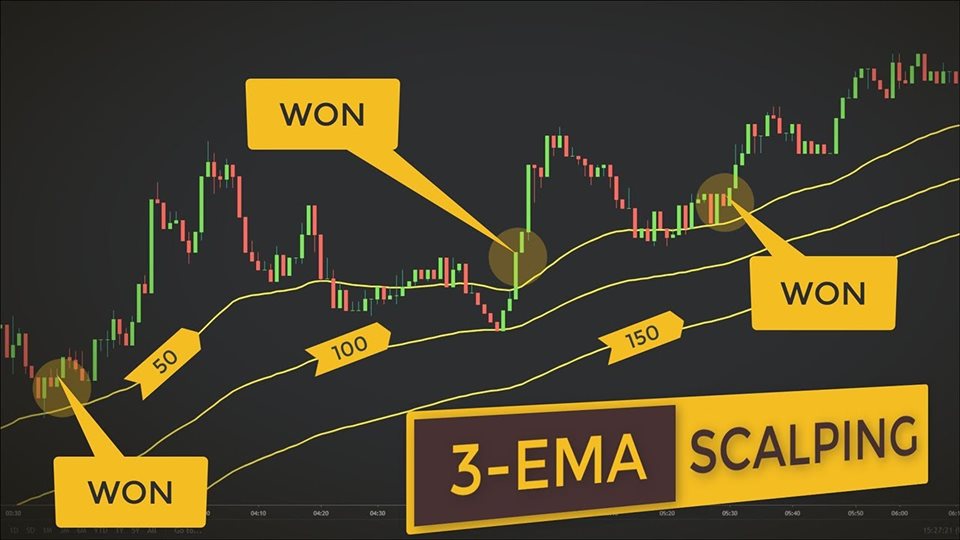
Use moving averages: Apply moving averages to the TSV chart to identify trend changes and generate trade signals. For instance, a bullish crossover of a shorter-term moving average above a longer-term moving average could indicate a buy signal, while a bearish crossover could suggest a sell signal.
-
Combine with other indicators: Consider using the TSV indicator in conjunction with other technical indicators to strengthen trade signals. For instance, you could combine it with oscillators like the Relative Strength Index (RSI) or Moving Average Convergence Divergence (MACD) to confirm entry and exit points.
-
Practice risk management: As with any trading strategy, it’s important to implement proper risk management techniques. Set stop-loss orders to limit potential losses and determine position sizes based on your risk tolerance and the overall market conditions.
Remember, the TSV indicator is just one tool among many, and it’s essential to validate its signals with other technical analysis methods and market indicators. Regularly monitor and adjust your trading strategy based on the performance and effectiveness of the TSV indicator in different market conditions.
Please note that while the TSV indicator can provide valuable insights, it’s always advisable to test and validate any trading strategy using historical data or in a simulated trading environment before applying it to real-time trading.


