|
如果免费资源下载的文件为TXT文档 请联系站长更新!站长微信:Lv596999 Telegram:@eapoj “Mql5官网”板块的EA基本都有,大部分是无限制NODLL版,NODLL版本MT1420升级,大多数不可用!这些EA来源为国外花钱买过来的 如有需要,请联系站长! “EA测评”板块资源全部现有,看见不错的,可以联系站长,看EA在确定是否收费。 “无限制EA”板块,大部分免费,下载文件全部存在,都可以免费下载。 站长硬盘EA太多,因大部分时间做交易,做风控,没太多时间更新下载地址,请谅解! 需要更新下载文件,请联系站长微信!国外朋友请联系Telegram。  |
Unleash the Power of Repetitive Market Price Levels (Markets often repeat structure).
Are you tired of guessing the crucial support and resistance levels in your trading strategy? Do you want to enhance your decision-making process with reliable and accurate market insights? Look no further! We proudly present the interactive digital product designed to transform your trading experience – the Ultimate Support and Resistance Zones Indicator.
Unlock the Potential of Critically Watched Support and Resistance Zones: The Support and Resistance Zones Indicator is a cutting-edge tool that draws the most vital support and resistance price zones, closely monitored by traders and institutions worldwide. With precision and accuracy, this indicator identifies key levels where the market has historically exhibited significant reversals and turning points in the past and makes for adjustments based on current market conditions.
Advanced Algorithm for Optimal Results: Our indicator incorporates a sophisticated algorithm that harnesses the power of historical price data, market dynamics, and technical analysis principles. By utilizing the latest advancements in trading technology, it skillfully identifies robust support and resistance zones, enabling you to make well-informed trading decisions.
Navigate Market Swings with Confidence: Gone are the days of indecision and confusion. The Support and Resistance Zones Indicator empowers you to navigate market swings with confidence. Selling near resistance and buying at support has long been a proven strategy, and this indicator precisely pinpoints those critical levels for you.
User-Friendly Interface for Seamless Trading: We understand the importance of a seamless and intuitive user experience. That’s why we’ve developed a user-friendly interface that allows you to effortlessly integrate the Support and Resistance Zones Indicator into your trading platform. Whether you’re a novice trader or an experienced professional, this powerful tool will enhance your trading experience.
Comprehensive Market Analysis: Our indicator goes beyond basic support and resistance identification. It provides a comprehensive analysis of market structures, identifying swing highs and swing lows based on a customizable period defined by you. This breakthrough feature saves you time and effort, enabling you to focus on what matters most – executing profitable trades.
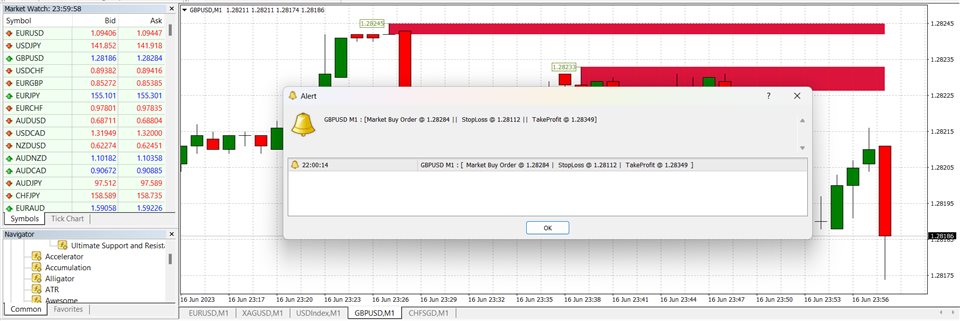
Accurate Price Entry: Our indicator gives the right price entry with each signal so that you are properly guided on your entries.
Always remember to combine our indicator with proper risk management to achieve optimal results.
Don’t miss out on this game-changing tool. Join thousands of traders worldwide who have already revolutionized their trading strategies with the Support and Resistance Zones Indicators. Get your copy today and embark on a journey towards trading excellence.
How to use
1. Load the Indicator on a Meta trader four chart of the symbol and time frame of your choice.
2a. Input the range of candle sticks for the indicator to scan market patterns.
2b. Switch ON or OFF, the notification feature which determines if the program sends notification to your MetaTrader App on your mobile device.
3. Take market positions only when a signal alert comes in.
4. For pending orders, easily create pending limits with prices shown at the zones.
5. The rectangular objects littered across the chart, (and in-between major support and resistance zones) are contraction and expansion zones.
6. Avoid entering swing trades at expansion and contraction zones (rectangular light colored regions drawn on the chart), as the price may go either way.
7. If you are scaping, and the market price enters an expansion and contraction zone, use the double dotted moving averages as a guide on going long or short. i.e., if the expansion zone is below the duo, and the expansion zone is colored pale slate-blue go long, if the expansion zone is above the duo, and the expansion zone is colored hot-pink go short, outside these conditions, do not take a trade entry.
![图片[1]-Mql5官网 Ultimate Support and Resistance Zones Indicator 外汇EA-EA侦探社 - 全球领先的MQL5官网外汇EA机器人MT4自动化交易EA资源免费分享网站](https://www.mql5.vip/wp-content/uploads/2024/05/20240516172829-6646423d0d474.jpg)
![图片[2]-Mql5官网 Ultimate Support and Resistance Zones Indicator 外汇EA-EA侦探社 - 全球领先的MQL5官网外汇EA机器人MT4自动化交易EA资源免费分享网站](https://www.mql5.vip/wp-content/uploads/2024/05/20240516172830-6646423e6f49e.jpg)
![图片[3]-Mql5官网 Ultimate Support and Resistance Zones Indicator 外汇EA-EA侦探社 - 全球领先的MQL5官网外汇EA机器人MT4自动化交易EA资源免费分享网站](https://www.mql5.vip/wp-content/uploads/2024/05/20240516172831-6646423fdfd1b.jpg)
![图片[4]-Mql5官网 Ultimate Support and Resistance Zones Indicator 外汇EA-EA侦探社 - 全球领先的MQL5官网外汇EA机器人MT4自动化交易EA资源免费分享网站](https://www.mql5.vip/wp-content/uploads/2024/05/20240516172833-6646424171728.jpg)
![图片[5]-Mql5官网 Ultimate Support and Resistance Zones Indicator 外汇EA-EA侦探社 - 全球领先的MQL5官网外汇EA机器人MT4自动化交易EA资源免费分享网站](https://www.mql5.vip/wp-content/uploads/2024/05/20240516172834-66464242aa224.jpg)
![图片[6]-Mql5官网 Ultimate Support and Resistance Zones Indicator 外汇EA-EA侦探社 - 全球领先的MQL5官网外汇EA机器人MT4自动化交易EA资源免费分享网站](https://www.mql5.vip/wp-content/uploads/2024/05/20240516172836-664642440c902.jpg)