
|
如果免费资源下载的文件为TXT文档 请联系站长更新!站长微信:Lv596999 Telegram:@eapoj “Mql5官网”板块的EA基本都有,大部分是无限制NODLL版,NODLL版本MT1420升级,大多数不可用!这些EA来源为国外花钱买过来的 如有需要,请联系站长! “EA测评”板块资源全部现有,看见不错的,可以联系站长,看EA在确定是否收费。 “无限制EA”板块,大部分免费,下载文件全部存在,都可以免费下载。 站长硬盘EA太多,因大部分时间做交易,做风控,没太多时间更新下载地址,请谅解! 需要更新下载文件,请联系站长微信!国外朋友请联系Telegram。  |
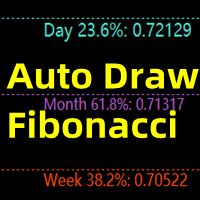
This indicator is mainly used to analyze future support and resistance levels for better trade analysis.
If the support level is effectively supported for many times, the market will break through the previous high point, and the effective trend breakout will be long.
After the down, the market cannot overshoot the pressure level for many times, and then goes down and breaks through the previous low price again, and the effective trend breaks through the short position.
When the market reaches the historical high or low price area, only two levels of Fibonacii lines may be drawn on the chart, and there is no daily level prompt, which is normal, because the indicator needs to wait for a certain space for the market to pull back before drawing, the indicator automatically draws The filtered small fluctuations in the high price range are not enough to analyze the effective support and resistance positions in the short period.
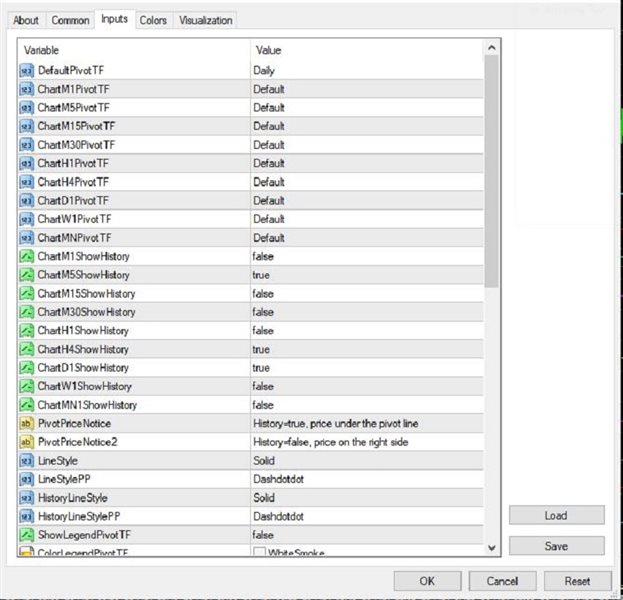
About parameters: high or low prices previous day-lines: If the high point drawn at the monthly level does not conform to the chart, please adjust this parameter, generally the number of K-lines on the daily line from the previous high (low) point to the present.
Month level color: Line and file prompt color at month level
Weekly Level color: Weekly level line and file prompt color
Dayline Level color: Line and file prompt color at dayline level
Text Font Name: Set the prompt font name
Font Size for month: The month-level prompt fontsize
Font Size for wee: The week-level prompt fontsize
Font Size for day: The day-level prompt fontsize
Special Note: The indicator only draws a fixed price for support and resistance. For effective analysis, please automatically add a certain number of points to the price to calculate a support and resistance range, because the market development is affected by too many factors and cannot be accurate to a fixed value. price. ![图片[1]-Mql5官网 Fibolacci Autodraw in Mt4 外汇EA-EA侦探社 - 全球领先的MQL5官网外汇EA机器人MT4自动化交易EA资源免费分享网站](https://www.mql5.vip/wp-content/uploads/2024/05/20240516173031-664642b7e4f0e.jpg)
![图片[2]-Mql5官网 Fibolacci Autodraw in Mt4 外汇EA-EA侦探社 - 全球领先的MQL5官网外汇EA机器人MT4自动化交易EA资源免费分享网站](https://www.mql5.vip/wp-content/uploads/2024/05/20240516173032-664642b829ca0.jpg)
![图片[3]-Mql5官网 Fibolacci Autodraw in Mt4 外汇EA-EA侦探社 - 全球领先的MQL5官网外汇EA机器人MT4自动化交易EA资源免费分享网站](https://www.mql5.vip/wp-content/uploads/2024/05/20240516173032-664642b86dab0.jpg)