
|
如果免费资源下载的文件为TXT文档 请联系站长更新!站长微信:Lv596999 Telegram:@eapoj “Mql5官网”板块的EA基本都有,大部分是无限制NODLL版,NODLL版本MT1420升级,大多数不可用!这些EA来源为国外花钱买过来的 如有需要,请联系站长! “EA测评”板块资源全部现有,看见不错的,可以联系站长,看EA在确定是否收费。 “无限制EA”板块,大部分免费,下载文件全部存在,都可以免费下载。 站长硬盘EA太多,因大部分时间做交易,做风控,没太多时间更新下载地址,请谅解! 需要更新下载文件,请联系站长微信!国外朋友请联系Telegram。  |
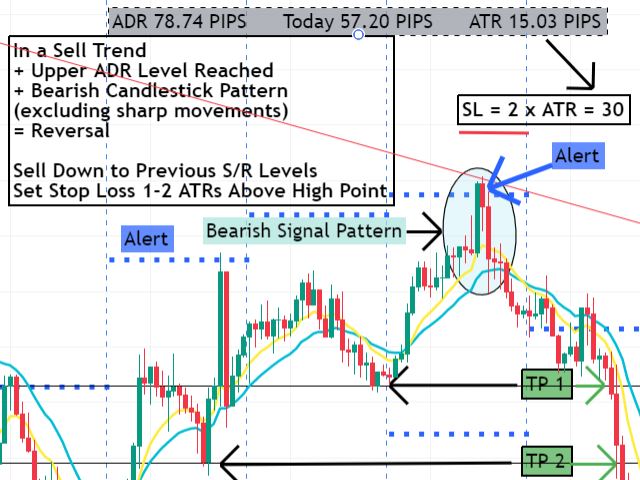
The Daily Range and ADR Reversal Indicator shows you where price is currently trading in relation to its normal average daily range. You will received alerts via pop-ups when price exceeds its average daily range. This alert is a signal for a potential pullback or reversal. This gives you an edge on identifying and trading pullbacks and reversals quickly.
The Indicator also shows you the Daily Range of Price for the current market session as well as previous market sessions. It shows you the ATR which is the average range of pips that a candle may move in that particular timeframe (5M – D1). I use the ATR when setting my Stop Loss ( i.e., 1-2 ATRs above Previous High for Sells or Below Previous Lows for Buys).
The Indicator calculates and displays the percentage of the ADR and ATR that price has moved in the past and present. You’re also able to look at the historical ADR DR and DR data.
You can change the colors of the ADR Level Lines, Hide or Show the previous and/or present Level Lines and choose how far back you would like to see where the level lines were drawn.
You can hide or show the historical data.
———————————- STRATEGY ———————————-
This indicator draws horizontal lines on the chart at the Average Daily Range extremes. When price reaches the extremes, you will get instant pop up alerts.
Wait for price to close outside of the extreme level. When price closes outside of the extreme, identify whether price is in a Buy (Bullish) Trend or Sell (Bearish) Trend.
BUY TREND
If you’re in a Buy Trend and received an alert stating that the Upper ADR Level has been reached:
This is a signal for a possible Pullback – meaning price is looking to fall and then return to its original high point.
WHAT TO DO:
After receiving the ADR Level Alert, wait for/make sure price has closed above the Upper ADR Level Line. Wait for 1 – 2 Bearish candles to close or a Bearish Candle Pattern and then look to the left to find and sell down to the previous level of Support/Resistance. Set your Stop Loss to 1-2 ATRs above the previous High Bullish Candle High Point.
If you missed your entry to sell on the pullback down, or if you prefer not to sell against the Buy Trend, you can wait until price shows a bullish signal (i.e., hammer, engulfing bullish candle) and then trade back up to the original high point.
If you’re in a Buy Trend and received an alert stating that the Lower ADR Level has been reached:
This is a signal for a possible reversal- meaning that price is looking to rise and return back to its original high point from which it fell from.
WHAT TO DO:
After receiving the ADR Level Alert, wait for/make sure price has closed below the Low ADR Level. Wait for 1-2 Bullish candles to close or a Bullish Candle Pattern and then look to the left to find and buy up to the previous level of support/resistance.
SELL TREND
If you’re in a Sell Trend and received an alert stating that the Lower ADR Level has been reached:
This is a Signal for a possible Pullback, meaning that price is looking to rise and then return back down to its original low point.
WHAT TO DO:
After receiving the ADR Level Alert, wait for/make sure price has closed below the ADR Level then wait for the close of 1 – 2 Bullish candles or Bullish Signal pattern and then look to the left and buy up to the previous level of Support/Resistance. Set your Stop Loss to 1-2 ATRs below the previous lowest Bearish Candle’s low point.
Just reverse the process if your Upper ADR Level was reached. In a sell trend, this is a signal for a reversal. When a bearish pattern forms, price is then looking to fall.
ADDITIONAL COMPLIMENTARY PRODUCTS AVAILABLE HERE:
ALSO AVAILABLE IN MT5 HERE:
Fibonacci Retracements and Extensions Tool: https://www.mql5.com/en/market/product/94303
Multiple Moving Averages Crossover Alerts: https://www.mql5.com/en/market/product/94369
Key Swing Levels: https://www.mql5.com/en/market/product/94545
![图片[1]-Mql5官网 Daily Range and ADR Reversal Indicator 外汇EA-EA侦探社 - 全球领先的MQL5官网外汇EA机器人MT4自动化交易EA资源免费分享网站](https://www.mql5.vip/wp-content/uploads/2024/05/20240516190539-66465903db781.png)
![图片[2]-Mql5官网 Daily Range and ADR Reversal Indicator 外汇EA-EA侦探社 - 全球领先的MQL5官网外汇EA机器人MT4自动化交易EA资源免费分享网站](https://www.mql5.vip/wp-content/uploads/2024/05/20240516190540-6646590449ded.png)
![图片[3]-Mql5官网 Daily Range and ADR Reversal Indicator 外汇EA-EA侦探社 - 全球领先的MQL5官网外汇EA机器人MT4自动化交易EA资源免费分享网站](https://www.mql5.vip/wp-content/uploads/2024/05/20240516190540-66465904adf4b.png)