
|
如果免费资源下载的文件为TXT文档 请联系站长更新!站长微信:Lv596999 Telegram:@eapoj “Mql5官网”板块的EA基本都有,大部分是无限制NODLL版,NODLL版本MT1420升级,大多数不可用!这些EA来源为国外花钱买过来的 如有需要,请联系站长! “EA测评”板块资源全部现有,看见不错的,可以联系站长,看EA在确定是否收费。 “无限制EA”板块,大部分免费,下载文件全部存在,都可以免费下载。 站长硬盘EA太多,因大部分时间做交易,做风控,没太多时间更新下载地址,请谅解! 需要更新下载文件,请联系站长微信!国外朋友请联系Telegram。  |
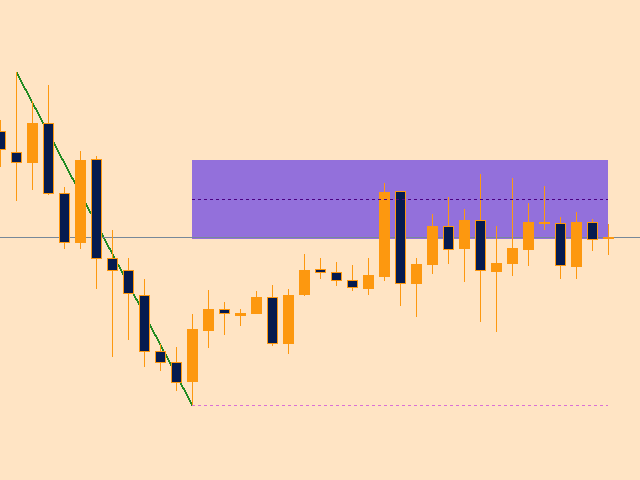
VaviStar is an indicator based on trend retracements determined by ZigZag segments.
It is theorized, and statistics confirm, that stocks react to certain retracement levels. Many use Fibonacci retracement levels (23.6%, 38.2%, 61.8%).
It is assumed that once the price goes beyond the 61.8% retracement, we can already speak of a trend reversal.
This indicator allows you to comfortably chart a segment of the ZigZag with the relative operating levels chosen.
With a reversal mindset, you can use it to trade between stop loss and retracement levels (perhaps 61.8%).
With a trend follower mentality, one can look for a restart after bounces off the retracement level (perhaps 23.6% or 38.2%).
For strategies like these, it is advisable to deactivate the display of the Stop Loss level.
Real-time use.
If we evaluate the current segment and if “show StopLoss line” to “true”, we will be updated tick by tick if the target is still contemplated as it is still closer than the retracement level.
Graphically, the last generated segment will be pointed to and relative levels will be updated with each quotation change.
Historical usage.
The indicator is perfect for searching history. With the push-button panel and the “<” and “>” buttons we can scroll through all the segments and check how our strategy would have worked or we can go in search of key levels.
We may use different time frames to find support and resistance levels.
In the history, based on how we place the mouse on the chart (aiming for the potential market entry point and based on the stop loss – if “show StopLoss line” to “true”) we will be notified where the target level would have been placed.
Scrolling back the chart will also allow us to go and find price levels never reached and never touched. Leaving the default parameters we can find those that we could compare to POCs. Let me explain, POCs (point of control) are deduced from strong volumes; with VaviStar we do not use volumes but levels that, statistically, make the price react.
Graphic customization.
In addition to the colors, it will be possible to customize the position of all the elements.
Input parameters:
ZigZag parameters
ZZ Depth: It is used to set the “Depth” parameter of the ZigZag;
ZZ Deviation: It is used to set the “Deviation” parameter of the ZigZag;
ZZ BackStep: It is used to set the “BackStep” parameter of the ZigZag;
Strategy parameters
Retracement %: It is used to set at what retracement percentage a market reaction is expected;
Show Stop Loss line: If set to “true”, the Stop Loss line will be drawn starting from the right end of the ZigZag segment;
StopLoss Shift: Used to set how many points of distance to place the Stop Loss line with respect to the maximum and minimum indicated by the Zig Zag segment;
Yield multiplier: It is used to set the target based on the distance from the Stop Loss;
Graphic parameters
Font size: It is used to set the font size; the size of all the graphic elements depends on this parameter;
Distance X line 1: It is used to set the distance of text line 1 from the ordinate axis;
DistanceY line 1: It is used to set the distance of text line 1 from the abscissa axis;
Distance X line 2: It is used to set the distance of text line 2 from the ordinate axis;
DistanceY line 2: It is used to set the distance of text line 2 from the abscissa axis;
Text color if BUY: Serves to set the text color in bullish situations;
Text color if SELL: It is used to set the text color in bearish situations;
StopLoss line color: It is used to set the color of the line indicating the Stop Loss level;
Retracements % line color: It is used to set the color of the line indicating the retracement level;
Target line color: It is used to set the color of the line indicating the Target level;
Edit text color: It is used to set the color of the text in the edit window;
Show area: If true, an area will be drawn around the retracement line;
Area width in %: It is used to set the width, expressed as a percentage, of the area around the retracement line;
Color area: It is used to set the color of the area around the retracement line;
Distance X Buttons: It is used to set the distance of the push-button panel from the ordinate axis;
Distance Y Buttons: It is used to set the distance of the push-button panel from the ordinate axis.
For any information or for further operational suggestions, write to us at info@followthegainstar.com.
![图片[1]-Mql5官网 VaviStar retracement indicator 外汇EA-EA侦探社 - 全球领先的MQL5官网外汇EA机器人MT4自动化交易EA资源免费分享网站](https://www.mql5.vip/wp-content/uploads/2024/05/20240516195428-6646647424065.png)
![图片[2]-Mql5官网 VaviStar retracement indicator 外汇EA-EA侦探社 - 全球领先的MQL5官网外汇EA机器人MT4自动化交易EA资源免费分享网站](https://www.mql5.vip/wp-content/uploads/2024/05/20240516195429-66466475391eb.png)
![图片[3]-Mql5官网 VaviStar retracement indicator 外汇EA-EA侦探社 - 全球领先的MQL5官网外汇EA机器人MT4自动化交易EA资源免费分享网站](https://www.mql5.vip/wp-content/uploads/2024/05/20240516195430-664664769e6cf.png)
![图片[4]-Mql5官网 VaviStar retracement indicator 外汇EA-EA侦探社 - 全球领先的MQL5官网外汇EA机器人MT4自动化交易EA资源免费分享网站](https://www.mql5.vip/wp-content/uploads/2024/05/20240516195431-66466477d3a5a.png)