
|
如果免费资源下载的文件为TXT文档 请联系站长更新!站长微信:Lv596999 Telegram:@eapoj “Mql5官网”板块的EA基本都有,大部分是无限制NODLL版,NODLL版本MT1420升级,大多数不可用!这些EA来源为国外花钱买过来的 如有需要,请联系站长! “EA测评”板块资源全部现有,看见不错的,可以联系站长,看EA在确定是否收费。 “无限制EA”板块,大部分免费,下载文件全部存在,都可以免费下载。 站长硬盘EA太多,因大部分时间做交易,做风控,没太多时间更新下载地址,请谅解! 需要更新下载文件,请联系站长微信!国外朋友请联系Telegram。  |
Dear Traders this is my another tool called “Swing Master Indicator“.
As the name above the indicator is designed to help you in swing trading by capturing the low and highs of the price. You may us this tool with any trading strategy and style from scalping to position trading. It is made for level of traders including newbies and advanced traders even prop-firms, hedge funds and banks to help them make sold market analysis. I create tools for serious traders who want to make a difference in trading. Invest wisely!
How is this this tool designed?
- The design of this tool is simple yet awesome. It is color coded with a meaningful reason and elegant!
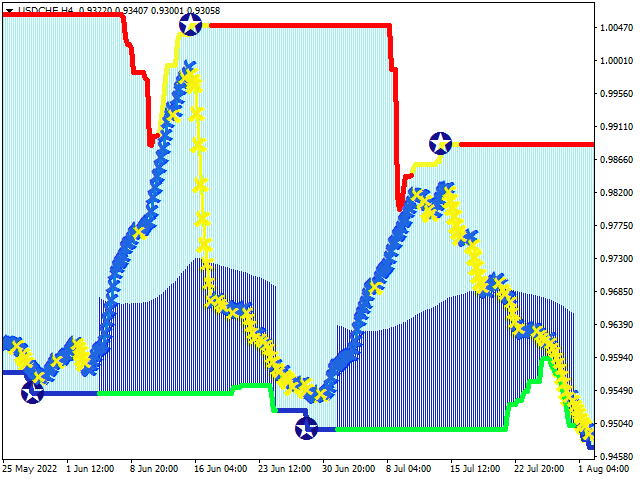
- We have the channel with red line at the top and the light green channel line at the bottom or lower part.
- On the red and yellow channel lines you will find other colors that also have a meaning. These are yellow and blue colors respectively.
- We have the blue and yellow line with blue and yellow stop arrows for trend direction signals or buy/sell signals.
- we have the navy blue round or starred circles for swing points to show the swing levels. You will find that this swing circles tend to repaint to calculate the exact swing level at which the price showed a clear bounce. This should not bother you because it is part of the strategy and you have to learn how to work with them to have a great picture of the price movement.
Inputs
- No complex inputs. It is better not to change anything in the input except you may consider changing the color of swing points when you work with black background on your chart to make the swing point visible.
Time-frame
- The indicator can be used for all time-frame depending on what you focus on as your entry point.
- The higher time frame such as H1, H4, Daily,weekly and Monthly are recommended if you also focus on the blue yellow trend line in the middle for taking trades. But if you consider the channel upper and lower lines only for taking trades then you can use this strategy on lower timeframe as well. The trading style can be clearly seen on the screenshot section.
Pairs
This tool works on all pairs
Markets
This tool can be used on all kind of markets known from Forex to stock markets and others.
How to trade with this tool.
This tool is based on four trading strategies or signals. They are as listed below
1. Demand and supply strategy-You may us the channel as your supply and demand zone indicator to know at what level there is a high chance of buying and selling pressure.
2. Trend strategy-this is represented by the blue and yellow line at the middle of the channel. Blue for bullish trend and yellow for bearish trend
3. Price Action Strategy– this includes the support and resistance level that makes the channel. When price shows a continuous breaking of lower channel line this is a signal for strong selling pressure and the when it continues to break the upper channel line than it is a signal for strong buying pressure.
4. Overbought and Oversold strategy-when you see the upper red line turning yellow that is an indicator that the price is overbought and the reversal is near. And when you see that the lower green line turning blue with discontinued or missing blue histogram lines this is a very strong signal that the price is extremely oversold and a reversal is very close and we should keep our two eyes wide open at this point to look for buy entry opportunities. You should take time to study this tool for more understanding.
Sell Trades
We open a sell trade when the swing circles touches the upper red line Or you can be a conservative and wait for the trend signal to turn yellow after the swing circles touches the upper red line.
Buy Trades
We open a buy trade when the swing circles touches the Lower green line Or you can be a conservative and wait for the trend signal to turn blue after the swing circles touches the lower green line. (check the screenshots).
Is this tool a great tool and reliable?
Well, I can’t promise you. Just give it a try and see it for yourself. The greatness of the tool will depend on your own knowledge about the tool and your trading analysis plus other factors. You should know that best traders are the one who make a tool great due to their wise decisions. Don’t gamble with this tool!
How do I get help if I get stuck?
Let me know if you need more help I will be glad to help. Send me a private message if there is a need.
![图片[1]-Mql5官网 Swing Master Indicator 外汇EA-EA侦探社 - 全球领先的MQL5官网外汇EA机器人MT4自动化交易EA资源免费分享网站](https://www.mql5.vip/wp-content/uploads/2024/05/20240516195814-66466556b2d44.png)
![图片[2]-Mql5官网 Swing Master Indicator 外汇EA-EA侦探社 - 全球领先的MQL5官网外汇EA机器人MT4自动化交易EA资源免费分享网站](https://www.mql5.vip/wp-content/uploads/2024/05/20240516195815-664665571712b.png)
![图片[3]-Mql5官网 Swing Master Indicator 外汇EA-EA侦探社 - 全球领先的MQL5官网外汇EA机器人MT4自动化交易EA资源免费分享网站](https://www.mql5.vip/wp-content/uploads/2024/05/20240516195815-66466557832e3.png)
![图片[4]-Mql5官网 Swing Master Indicator 外汇EA-EA侦探社 - 全球领先的MQL5官网外汇EA机器人MT4自动化交易EA资源免费分享网站](https://www.mql5.vip/wp-content/uploads/2024/05/20240516195815-66466557e9101.png)
![图片[5]-Mql5官网 Swing Master Indicator 外汇EA-EA侦探社 - 全球领先的MQL5官网外汇EA机器人MT4自动化交易EA资源免费分享网站](https://www.mql5.vip/wp-content/uploads/2024/05/20240516195816-66466558631b8.png)