
|
如果免费资源下载的文件为TXT文档 请联系站长更新!站长微信:Lv596999 Telegram:@eapoj “Mql5官网”板块的EA基本都有,大部分是无限制NODLL版,NODLL版本MT1420升级,大多数不可用!这些EA来源为国外花钱买过来的 如有需要,请联系站长! “EA测评”板块资源全部现有,看见不错的,可以联系站长,看EA在确定是否收费。 “无限制EA”板块,大部分免费,下载文件全部存在,都可以免费下载。 站长硬盘EA太多,因大部分时间做交易,做风控,没太多时间更新下载地址,请谅解! 需要更新下载文件,请联系站长微信!国外朋友请联系Telegram。  |
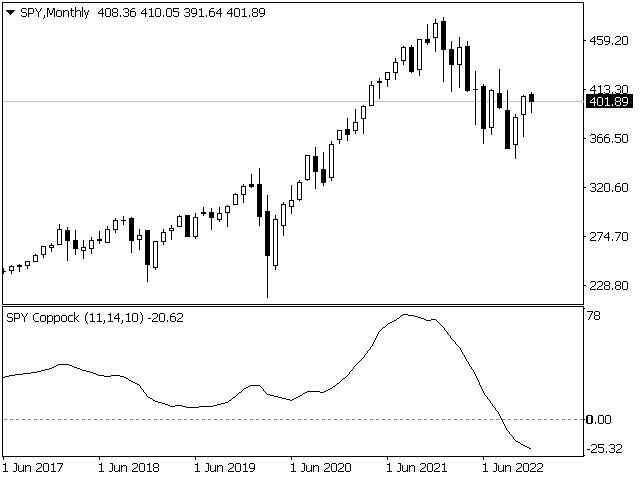
What Is the Coppock Curve?
The Coppock Curve is a long-term price momentum indicator used primarily to recognize major downturns and upturns in a stock market index. It is calculated as a 10-period weighted moving average of the sum of the 14-period rate of change and the 11-period rate of change for the index. It is also known as the “Coppock Guide.”
Example of How to Use the Coppock Curve
Apply the Coppock Curve to a weekly/monthly price chart of a stock index or stock index exchange traded fund. The general strategy is to buy when the Curve rises above the zero line and consider selling when the Curve falls below zero. For investors who already own the ETF, when the Coppock curve is above zero the indicator is signaling to hold onto the investment.
The indicator kept investors out of a portion of the 2001 and 2008 stock market declines. However, in 2016, the indicator provided a sell signal near the market bottom and then gave a buy signal a short time after at a higher price.
The Difference Between the Coppock Curve and Rate of Relative Strength Index (RSI)
The relative strength index looks at how the current price compares to prior prices, though it is calculated differently than the rate of change (ROC) indicator used in the Coppock Curve calculation. Therefore, these indicators will provide different trade signals and information.
Limitations of the Coppock Curve
The major drawback of the Coppock Curve is the event of a false signal. False signals occur when the curve quickly moves above and below the zero line. This may cause traders to make purchases, but then the indicator says to sell them again, or vice versa.
Another drawback is curve fitting, a cognitive bias. The Coppock Curve is somewhat arbitrary in its default settings, and many traders adjust those settings to change the shape of the curve to better fit historical price data. Fitting the indicator to provide the best historical signals may not produce better future signals.
The indicator is also looking at 10-, 11-, and 14-month averages. The indicator will lag in flagging major market bottoms and tops.
![图片[1]-Mql5官网 Coppock Curve Indicator 外汇EA-EA侦探社 - 全球领先的MQL5官网外汇EA机器人MT4自动化交易EA资源免费分享网站](https://www.mql5.vip/wp-content/uploads/2024/05/20240516200323-6646668bbaee8.png)