
|
如果免费资源下载的文件为TXT文档 请联系站长更新!站长微信:Lv596999 Telegram:@eapoj “Mql5官网”板块的EA基本都有,大部分是无限制NODLL版,NODLL版本MT1420升级,大多数不可用!这些EA来源为国外花钱买过来的 如有需要,请联系站长! “EA测评”板块资源全部现有,看见不错的,可以联系站长,看EA在确定是否收费。 “无限制EA”板块,大部分免费,下载文件全部存在,都可以免费下载。 站长硬盘EA太多,因大部分时间做交易,做风控,没太多时间更新下载地址,请谅解! 需要更新下载文件,请联系站长微信!国外朋友请联系Telegram。  |
MACD Scanner provides the multi symbols and multi-timeframes of MACD signals. It is useful for trader to find the trading idea quickly and easily. User-friendly, visually clean, colorful, and readable.
Dynamic dashboard display that can be adjusted thru the external input settings. Total Timeframes and Total symbols as well as the desired total rows/panel, so it can maximize the efficiency of using the chart space.
The Highlight Stars on the certain matrix boxes line based on the selected Scan Mode that is also followed up by alert. This feature can be useful for trader to find the most potential symbol quickly to make the trading decision.
Including additional signal arrows on the chart to support the MACD signals on the panel.
Consists of 5 scanning modes:
- Lines Trend. If MACD Line above Signal Line then the matrix box color is Blue. And conversely if MACD Line below Signal Line then the color is Red.
- Upper/Lower Level 0. If MACD Line and Signal Line is above level 0 then the matrix box color is Blue. And if MACD line and Signal line is below level 0 then the color is Red.
- Upper/Lower Level 0 & Lines Trend. This is the combination of the previous mode 1 and mode 2. If MACD Line above Signal Line and the MACD Line and Signal Line is above level 0 then the matrix box color is Blue. And if MACD Line below Signal Line and the MACD Line and Signal Line is below level 0 then the color is Red.
- Crossover Lines. This is the cross up/down between the two lines of MACD. If the current MACD Line is above Signal Line and the previous MACD Line is below Signal Line then the matrix box color is Blue. And if the current MACD Line is below Signal Line and the previous MACD Line is above Signal Line then the color is Red.
- Crossover Level 0. Similar with Mode 4. But this is the cross over up/down the level 0. If the signal line cross up level 0 then the matrix box color is Blue and if cross down level 0, the color is Red.
The color Blue/Red above is adjustable thru the parameter input. You can change the color as your desire.
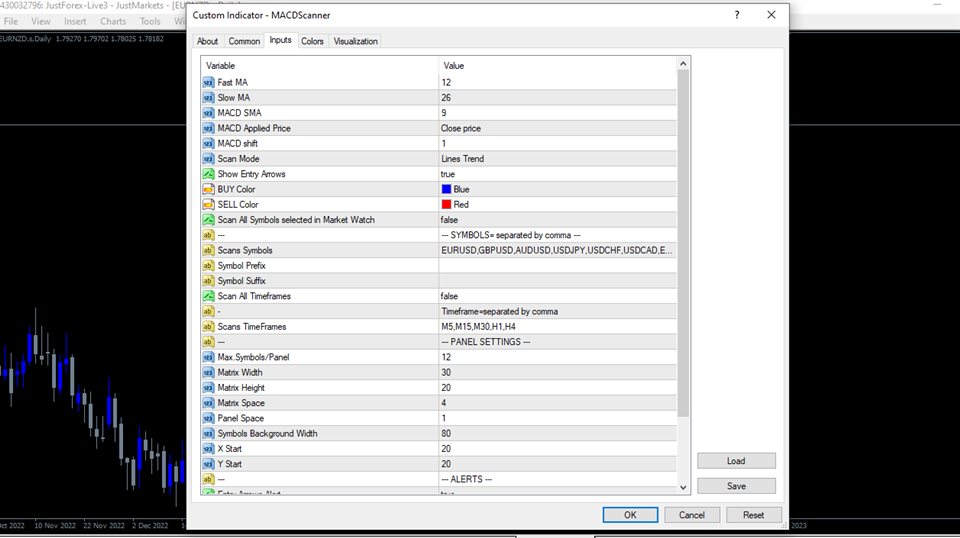
Parameters:
- Fast MA: This is MACD setting.
- Slow MA: This is MACD setting.
- MACD SMA: This is MACD setting.
- MACD Applied Price: This is MACD setting.
- MACD shift: This is MACD setting, Bar shift of MACD to be scanned, counted from right to left. Example: if the value=1, then indicator will scan the values of MACD signals on bar 1 of the selected timeframes and simbols.
- Scan Mode: There are 4 Scan Modes; Lines Trend, Upper/Lower Level 0, Upper/Lower Level 0 & Lines Trend, and CrossOver. Explained in the previous part above.
- Show Entry Arrows: If true, the MACD Scanner indicator will display arrows on the chart. Otherwise, false
- BUY Color: The Color of BUY arrow signals and matrix boxes on the panel.
- SELL Color: The Color of SELL arrow signals and matrix boxes on the panel.
- Scan All Symbols selected in Market Watch: If true, MACD Scanner Indicator will scan all symbols available on the market watch. Click Tab View – Market Watch to check all symbols available.
- Scans Symbols: In case, Scan All Symbol is false then specified the symbols here. Separated by comma.
- Symbol Prefix: Symbol prefix if available. This is the character before the symbol.
- Symbol Suffix: Symbol suffix if available. This is the character after the symbol.
- Scan All Timeframes: If true, MACD Scanner will scan all Timeframes available on the MT4. From 1 Minute to Monthly.
- Scans TimeFrames: In case, Scan All Timeframes is false then specified the timeframes here. Separated by commas without space. You can use the accepted Timeframe formats below and it can be a combination of them:
M1,M5,M15,M30,H1,H4,D1,W1,MN1
m1,m5,m15,m30,h1,h4,d1,w1,mn1
1,5,15,30,60,240,1440,10080,43200
- Max.Symbols/Panel: This is the maximum number of rows in the panel. Example: You scan 10 symbols and your Max.Symbols/Panel = 5 then there will be 5 symbols on every panel. Total = 2 panels.
- Matrix Width= this is the width value in pixels of matrix boxes in the panel.
- Matrix Height = this is the height value in pixels of matrix boxes in the panel.
- Matrix Space = the space in pixels between the matrix boxes.
- Panel Space = the horizontal space in pixels between panel.
- Symbols Background Width = This the symbols background width, this is provided to suit the long symbol name if available.
- X Start = The Panel Start in pixels, counted from left.
- Y Start = The Panel Start in pixels, from top.
- Entry Arrows Alert: If true, MACDScanner will send an alert if the signal arrow is triggered in case ‘Show Entry Arrows’ is true.
- Minimum Total TFs to alert/symbol: This is the minimum total TFs for the indicator to send alerts notification. Example: If the input value= 3 and M5, M15, and M30 are Blue then the Indicator will send a notification. This is not related to Signal Arrows but to the matrix signals on the panel. The parameters below should be turned to be true in order to get alerts.
- PopUp Alert Mobile Alert
- Email Alert
How the Alerts work
The indicator will look for symbols that have the most total signals in the same direction and more than ‘ Minimum Total TFs to alert/symbol’. If more than one symbol is found with the same total signal’s strength, the indicator will look for the symbol with the least opposite signals direction. Otherwise, it will send alert and drawing stars highlight on the matrix. If more than 1 symbol is still found, the indicator will look for the symbol with the most recent update.
It means that the symbol with stars highlight on the matrix is the most potential symbol based on the selected MACD Scan Mode.
Signal Arrows
The Signal Arrows are drawn on the current chart. No repaint and No lagging. This is an additional feature of MACDScanner. In the hope, it can help more for trader to gain profits. The arrows work based on RSI indicator. It means this can be interpreted as the oversold/overbought signals. Regarding signal usage depends on the MACDScanner Mode currently used and the trading strategy. It can be used as an exit point and also as an entry point as well.
For examples:
1. Scan Mode: Crossover Level 0 and you make a BUY entry when you get BUY alert from the scanner. Then you can exit when you find sell arrow on the candle. Or you can use the arrows to start to trail your position on the certain price level.
2. Scan Mode: Trend Lines and you get BUY alerts from the scanner on timeframes: M15,H1,H4. Then you can wait for BUY arrow on the lower timeframe, let’s say timeframe M5 or M15, to send Order Buy.
The Main function of MACDScanner Indicator is to provide MACD signals matrix on the panel. In case, you don’t want to use the arrow signals, you can hide from the chart. Parameter input is available to do it.
MT5 Version can be found here.
![图片[1]-Mql5官网 MACD Scanner Dashboard 外汇EA-EA侦探社 - 全球领先的MQL5官网外汇EA机器人MT4自动化交易EA资源免费分享网站](https://www.mql5.vip/wp-content/uploads/2024/05/20240516223211-6646896b0d82a.gif)
![图片[2]-Mql5官网 MACD Scanner Dashboard 外汇EA-EA侦探社 - 全球领先的MQL5官网外汇EA机器人MT4自动化交易EA资源免费分享网站](https://www.mql5.vip/wp-content/uploads/2024/05/20240516223211-6646896bc49da.png)
![图片[3]-Mql5官网 MACD Scanner Dashboard 外汇EA-EA侦探社 - 全球领先的MQL5官网外汇EA机器人MT4自动化交易EA资源免费分享网站](https://www.mql5.vip/wp-content/uploads/2024/05/20240516223212-6646896c3a55a.jpg)
![图片[4]-Mql5官网 MACD Scanner Dashboard 外汇EA-EA侦探社 - 全球领先的MQL5官网外汇EA机器人MT4自动化交易EA资源免费分享网站](https://www.mql5.vip/wp-content/uploads/2024/05/20240516223212-6646896ca1261.jpg)
![图片[5]-Mql5官网 MACD Scanner Dashboard 外汇EA-EA侦探社 - 全球领先的MQL5官网外汇EA机器人MT4自动化交易EA资源免费分享网站](https://www.mql5.vip/wp-content/uploads/2024/05/20240516223213-6646896d0137b.png)
![图片[6]-Mql5官网 MACD Scanner Dashboard 外汇EA-EA侦探社 - 全球领先的MQL5官网外汇EA机器人MT4自动化交易EA资源免费分享网站](https://www.mql5.vip/wp-content/uploads/2024/05/20240516223213-6646896d48f09.png)